Dashboard (📊)←
ภาพรวมการใช้งานระบบ — stat cards + bar chart + peak hours + OA performance
ภาพรวม←
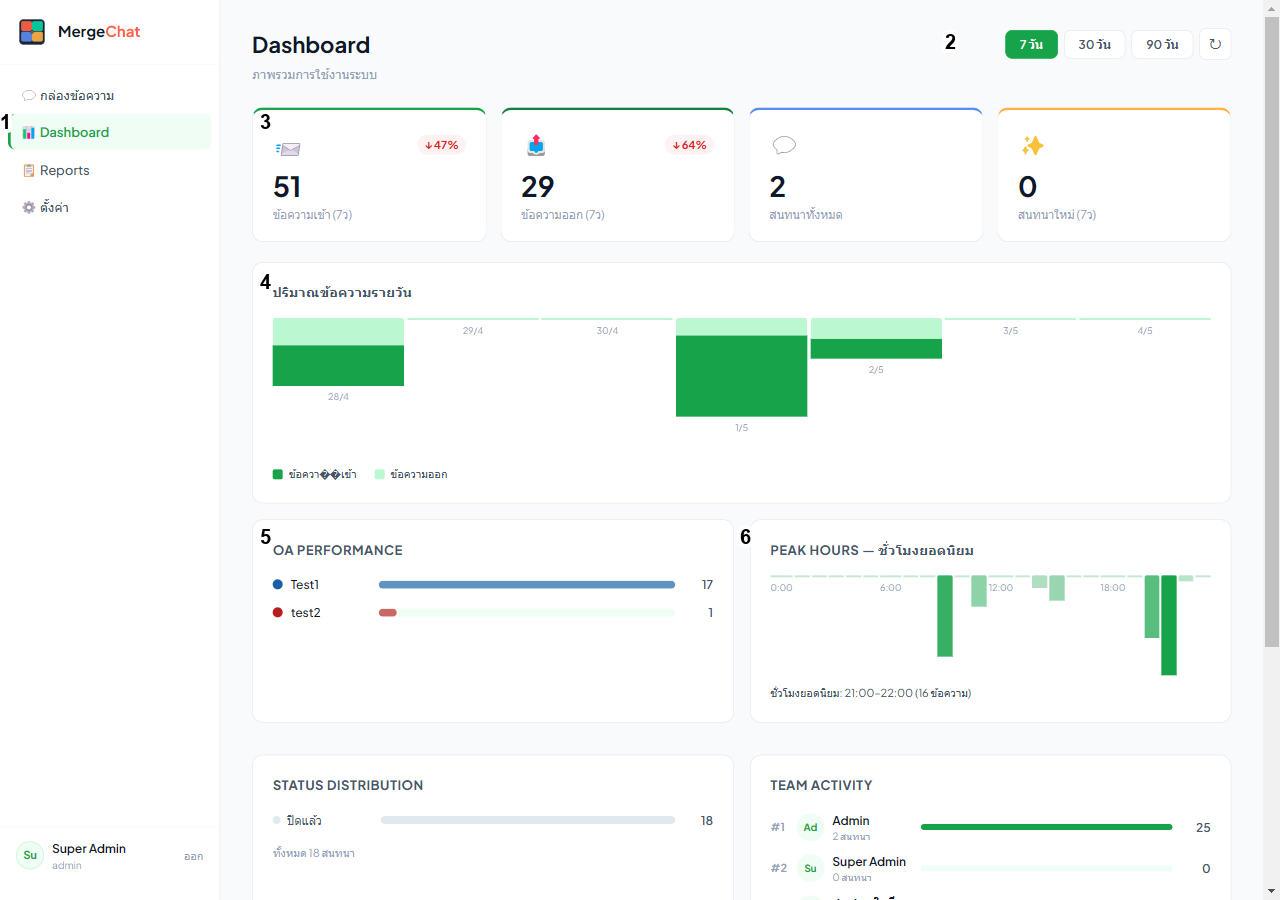
หมายเลขในรูป:
- Sidebar — Dashboard active
- Period selector — 7 วัน (default) / 30 / 90 + ปุ่ม refresh
- 4 stat cards — ข้อความเข้า 51 (↓47%), ข้อความออก 29 (↓64%), สนทนา 2, ใหม่ 0
- Bar chart รายวัน — inbound (เข้ม) + outbound (อ่อน) 7 วัน
- OA Performance — Test1: 17 conv, test2: 1 conv
- Peak Hours — chart ของชั่วโมงยอดนิยม (21:00-22:00 หนาแน่นสุด 16 msgs)
URL: /dashboard
ปุ่มเข้าถึง: ⚙️ มุมบนขวา → 📊 (หรือพิมพ์ /dashboard ใน URL)
หน้านี้แสดง:
- 4 Stat cards — ข้อความเข้า/ออก, สนทนา, สมาชิกใหม่
- Bar chart — ปริมาณข้อความรายวัน 7 วัน
- OA Performance — ranking OAs ตาม volume
- Peak Hours — ชั่วโมงที่ลูกค้าทักมากสุด
- Status Distribution — pie/bar เปิด/รอ/ปิด
- Team Activity — agents online + active hours
Period selector←
มุมบนขวา: 7 วัน (default) / 30 วัน / 90 วัน
Stat cards←
| Card | Source | Trend indicator |
|---|---|---|
| 📨 ข้อความเข้า (7ว) | COUNT(messages WHERE sender_type='customer') | เทียบ period ก่อนหน้า ↑↓ % |
| 📤 ข้อความออก (7ว) | COUNT(messages WHERE sender_type='agent') | เทียบ period ก่อนหน้า |
| 💬 สนทนาทั้งหมด | COUNT(conversations) | — |
| ✨ สนทนาใหม่ (7ว) | COUNT(conversations WHERE created_at > 7d ago) | เทียบ period ก่อนหน้า |
Bar chart รายวัน←
แกน X = วันที่ 7/14/30/90 หลังสุด แกน Y = จำนวนข้อความ 2 series: inbound (ลูกค้า) + outbound (agent)
OA Performance←
ranking OA ตามจำนวนข้อความเข้าใน period:
Peak Hours←
heatmap หรือ bar chart ของชั่วโมงที่ลูกค้าทักมากสุด — ใช้ตัดสินใจ shift agent
Status Distribution←
pie chart เปิด vs รอ vs ปิดแล้ว — ดู backlog
Team Activity←
list agents online + ชั่วโมง active วันนี้ — ดูว่าใครยังตอบอยู่
คำถามที่พบบ่อย←
Dashboard ว่างเปล่า
ยังไม่มี traffic — รอลูกค้าทักก่อน หรือ period ที่เลือกยังไม่มี data
ตัวเลขผิดจากความเป็นจริง
- ตรวจ timezone (ระบบใช้ UTC ภายใน → display เป็น Bangkok)
- period boundary: 7 วัน = 7×24h ที่ผ่านมา (ไม่ใช่ปฏิทิน)
- รีเฟรชหน้า
Export Dashboard ได้ไหม
Dashboard ไม่มี export — Reports มี CSV export
ที่อ้างอิง←
- Backend: GET
/api/reports/dashboard?days=7 - Source:
Dashboard.tsx - Reports (รายละเอียด agent): Reports